Logistic Regression
Loading Packages
using DataFrames, CSV, ScikitLearn, PyPlotThe above line of code will load the
CSV,DataFrames&ScikitLearnpackages.If you get error while executing the above line of code that means you have missed installing one or more packages. By checking the error message, you can figure out which package is missing.
Add the missing package by entering the package mode and installing them.
Once done with installing the missing packages, try re-running the above line of code.
Loading the dataset
data = CSV.File("covid_cleaned.csv") |> DataFrame20352×16 DataFrame
Row │ intubed pneumonia age pregnancy diabetes copd asthma inmsupr hypertension other_disease cardiovascular obesity renal_chronic tobacco contact_other_covid covid_res
│ Int64 Int64 Int64 Int64 Int64 Int64 Int64 Int64 Int64 Int64 Int64 Int64 Int64 Int64 Int64 Int64
───────┼──────────────────────────────────────────────────────────────────────────────────────────────────────────────────────────────────────────────────────────────────────────────────────
1 │ 0 0 25 0 0 0 0 0 0 0 0 0 0 0 1 1
2 │ 0 0 52 0 0 0 0 0 0 0 0 1 0 1 1 1
3 │ 0 1 51 0 0 0 0 0 0 0 0 0 0 0 1 1
4 │ 1 1 67 0 1 0 0 0 1 0 0 1 0 0 1 1
5 │ 0 1 59 0 1 0 0 0 0 0 0 0 0 0 1 1
6 │ 0 0 52 0 1 0 0 0 1 0 1 0 0 0 0 1
7 │ 0 1 54 0 0 0 0 0 0 0 0 0 0 0 0 1
8 │ 0 1 78 0 0 0 0 0 1 0 0 1 0 0 1 1
⋮ │ ⋮ ⋮ ⋮ ⋮ ⋮ ⋮ ⋮ ⋮ ⋮ ⋮ ⋮ ⋮ ⋮ ⋮ ⋮ ⋮
20346 │ 1 1 65 0 0 0 0 0 0 0 0 0 0 0 0 0
20347 │ 0 1 49 0 0 0 0 0 0 0 0 0 0 0 0 0
20348 │ 0 1 80 0 1 0 0 0 0 0 0 0 0 0 0 0
20349 │ 0 0 13 0 0 0 0 0 0 0 0 0 0 0 0 0
20350 │ 1 0 23 0 0 0 0 0 0 1 0 0 0 1 0 0
20351 │ 0 1 1 0 0 0 0 0 0 0 0 0 0 0 0 0
20352 │ 0 1 55 0 0 0 0 0 0 0 0 1 0 0 0 0
20337 rows omittedThe above line of code loads the
covid_cleaned.csv, converts it into a data frame, and saves it in a variable nameddata.
Specifying the target and predictors
The ScikitLearn package only accepts the data in array form, hence we need to convert our data into Arrays
X = convert(Array, data[!,Not(:covid_res)])
y = convert(Array, data[!,:covid_res]) # :covid_res is our target variable
The first line of code tells Julia to select all columns except
covid_resfromdataand store it in a new variableXas an Array.The second line of code tells Julia to just select
covid_resfromdataand save them inyas an Array.Here we are converting the data from DataFrame type to Array type because
ScikitLearnonly accepts the predictors and targets as Array data type.
Splitting the data into training set and test set
@sk_import model_selection: train_test_split
X_train, X_test, y_train, y_test = train_test_split(X,y, test_size = 0.33, random_state=42) # You can define the train/test size ratio using the test_size argument
The first line of code loads the
train_test_splitfunction to our project's scope fromScikitLearnpackage.The second line of code splits the X & Y into training and test sets. In the example we have set the ratio to be 50%. In general, a common ratio for training-test spilt is 80-20. i.e., 80% of the data will be used as training data and 20% as test data. To change the ratio to 80-20, you can change the
test_sizevalue to 0.2.If you want random sampling while splitting the data, assign a number to the
random_statevariable.
Model Definition
@sk_import linear_model: LogisticRegression
simplelogistic =LogisticRegression(penalty=:none)
This is how you define a simple logistic regression.
LogisticRegression()is equally correct, but when you don't specify penalty to be:none, scikit learn chooses L2 regularization by default.
Model Fitting
fit!(simplelogistic,X_train,y_train)This will fit your model to the training dataset.
Model Evaluation
Classification report with the training data:
y_pred = predict(simplelogistic,X_train)

@sk_import metrics: classification_report
print(classification_report(y_train,y_predict))
> precision recall f1-score support
0 0.63 0.45 0.52 5684
1 0.67 0.81 0.74 7951
accuracy 0.66 13635
macro avg 0.65 0.63 0.63 13635
weighted avg 0.65 0.66 0.65 13635Classification report with the test data:
y_pred = predict(simplelogistic,X_test)
print(classification_report(y_test,y_pred))
> precision recall f1-score support
0 0.64 0.45 0.53 2763
1 0.68 0.82 0.74 3954
accuracy 0.67 6717
macro avg 0.66 0.64 0.64 6717
weighted avg 0.66 0.67 0.66 6717Cross Validation
@sk_import model_selection: cross_val_score
cross_val_score(LogisticRegression(penalty=:none ), X_train, y_train)5-element Array{Float64,1}:
0.6615328199486615
0.6563989732306564
0.6604327099376605
0.6585991932526586
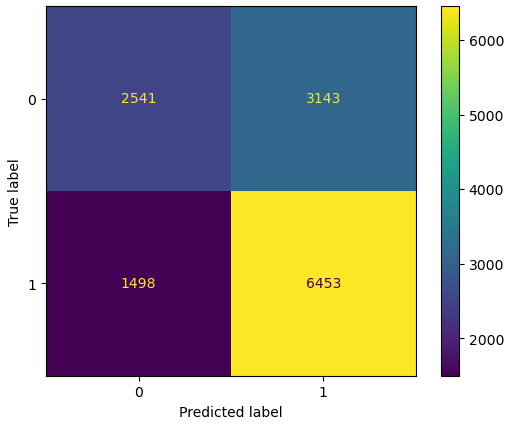
0.654932159882655Confusion Matrix
@sk_import metrics: plot_confusion_matrix
plot_confusion_matrix(simplelogistic,X_train,y_train)
PyPlot.gcf()